
GPU/CPU
UE5 GPU vs CPU Bottlenecks: How to Find the Real Problem
Read Game, Draw and GPU timings as clues, follow the limiting dependency in a capture, and verify a focused change against the same target workload.
How do you tell whether UE5 is CPU- or GPU-bound?
Start with stat unit in a representative build, then inspect the suspected limiting work in Unreal Insights. Game and Draw describe CPU-side thread timings; GPU describes graphics-device work. Compare them with Frame, but do not diagnose solely from the largest number. A thread can be waiting, a frame cap can hide headroom, and CPU and GPU work can overlap.
Define the bottleneck for a specific workload
CPU-bound means CPU-side work or a CPU-side dependency limits progress; GPU-bound means graphics-device work is the current limit. Neither is a permanent property of a project. The limit can change with the scene, target device, quality settings and even the frame being examined. Display-bound behavior occurs when VSync limits a workload that the CPU and GPU could otherwise produce faster.
Use milliseconds to reason about a budget. A 60 FPS target corresponds to approximately 16.67 ms per frame. That does not mean you can allocate 16.67 ms independently to every thread and add the results. Execution overlaps and synchronization connects frames. Improving work that already finishes before the limiting dependency may create headroom without increasing the final frame rate.
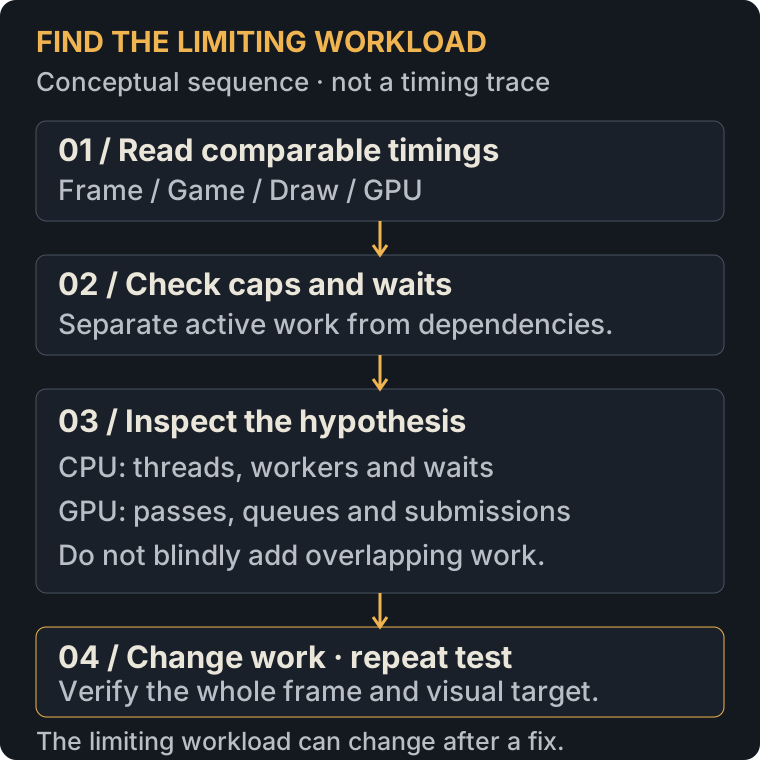
Read stat unit without treating it as a verdict
In a packaged Development build, open the console and enable the overview commands below. Development keeps diagnostic access that a standard Shipping build does not. Keep the same route, window mode, resolution, quality and frame-cap settings across comparisons. Profile a sustained slow interval and any isolated hitch separately.
stat unit
stat unitgraph
stat gpu| Field | What it describes | Interpretation caution |
|---|---|---|
| Frame | Overall frame timing. | Caps, synchronization and presentation constraints can affect the result. |
| Game | Game Thread timing. | A value near Frame suggests a Game Thread limit; inspect active work versus waits. |
| Draw | Rendering-thread timing on the CPU. | This is not GPU shader execution time. |
| GPU | GPU timing for rendering the scene. | A similar value to Frame is a clue, not proof of shader cost. Inspect the GPU workload and dependencies. |
| RHIT | RHI Thread timing when applicable. | Synchronization can make it resemble Frame; it is not a universal measure of driver overhead. |
| DynRes | Dynamic-resolution screen-percentage information when supported/enabled. | This is resolution information, not another thread whose milliseconds should be added. |
If several values move together, investigate the timeline rather than concluding that every processor is independently overloaded. Likewise, low aggregate CPU utilization does not rule out a CPU-side limit: one critical thread or dependency may constrain progress while other cores have spare capacity. “The GPU is not fully utilized” describes a symptom; it does not identify the work that must change.
Use controlled tests to strengthen the hypothesis
Change only rendering resolution for one comparison, using the project’s established settings. Record both output and internal render resolution. Hold dynamic resolution and upscaling behavior stable, along with the scene, quality, VSync and frame cap. Compare GPU timing as well as Frame; an unchanged capped frame rate can hide a reduction in GPU cost.
A meaningful reduction in GPU work when fewer pixels are rendered supports a resolution-sensitive GPU hypothesis. It is not a universal classifier. Some GPU work is weakly dependent on pixel count, CPU submission costs may remain, and upscaler or dynamic-resolution changes can invalidate the comparison. If the test does not change frame time, collect more evidence rather than declaring the project CPU-bound.
Apply the same discipline to CPU hypotheses: isolate the suspected subsystem while preserving the reproduction, then inspect whether its observed cost and the limiting frame interval changed. Disable features only as reversible diagnostic experiments. A test that removes shadows, simulation and half the scene together cannot tell you which change mattered or whether the result still meets the product’s requirements.
Hypothetical troubleshooting example: a slow camera view
This is a hypothetical reasoning example, not a measured benchmark, client project or personally performed test.
1. Observed symptom
Suppose a repeatable camera view feels consistently slower than the rest of a scene. Start with that sustained interval; do not assume it has the same cause as an occasional loading hitch elsewhere.
2. Metrics to inspect
Inspect Frame, Game, Draw and GPU in stat unit, watch their behavior in stat unitgraph, and record frame-cap, VSync, upscaler and dynamic-resolution settings. Check for a display limit or waiting before attributing the symptom to active CPU or GPU work.
3. Controlled diagnostic comparison
Repeat the identical camera view with only the internal rendering resolution reduced through the project’s established controls. Keep output resolution, quality and the rest of the workload comparable, and hold upscaling and dynamic-resolution behavior stable. Record GPU and Frame timings in both conditions.
4. Interpret the findings
If GPU work and the uncapped frame interval both decrease while CPU-side work remains comparable, that supports a resolution-sensitive GPU hypothesis. If GPU cost decreases but Frame does not, a cap or another dependency may hide the benefit. Little change does not prove a CPU limit: some GPU work is weakly resolution-dependent.
5. Evidence needed before optimizing
Capture the same slow interval in Insights and identify the expensive passes, CPU waits and queue dependencies. Check that the controlled comparison did not change which content was visible or how it rendered. Choose an optimization only after the trace supports the cause, then retest the whole frame and required visual quality.
Capture CPU work and dependencies in Unreal Insights
For a repeatable packaged test, the command-line options below request CPU events, frame markers, bookmarks and available GPU events and write a file trace. They are diagnostic options, not a universal launch command for every platform. Append them to your own executable invocation and use a writable absolute output path appropriate to that machine.
-trace=cpu,frame,bookmark,gpu -tracefile="C:/Traces/BottleneckReview.utrace"Open the .utrace in Unreal Insights. Use Timing Insights to select the slow interval, then inspect the Game Thread, rendering thread, worker activity and GPU tracks available in that capture. For CPU work, expand event scopes, compare neighboring frames and use the Timers, Callers and Callees panels to understand the calling context.
Do not add a parent scope to all of its children as if those were independent costs. Similarly, distinguish a single large call from a small call repeated many times. When a long interval is waiting, follow the work it depends on; reducing unrelated gameplay code may leave that wait unchanged. If the trace lacks enough names or channels to establish the dependency, take a more focused capture instead of guessing from a blank region.
Inspect GPU passes and queue dependencies
Use GPU statistics for orientation, then inspect named GPU events in Insights on a supported RHI. Identify the expensive pass or group of work in the actual slow interval. Typical investigation areas include shadow rendering, base-pass/material work, translucency, lighting and post-processing; the event names and grouping depend on the renderer, features and engine version. Do not assign every expensive pass to Lumen or Nanite merely because those features are enabled.
UE 5.6 introduced a re-architected Insights GPU profiler. Its common event stream is intended to improve consistency across Stats, ProfileGPU and Insights, with visibility into async queues, GPU idle/busy states and cross-queue fence dependencies. Do not assume a tutorial for an older ProfileGPU interface describes the exact UI or output you will see in 5.6.
Read the queue timeline, not just a list of pass durations. Work on graphics and asynchronous compute queues can overlap, so adding all durations can overstate the elapsed interval. A gap can indicate the GPU is waiting for submitted work or a dependency; it is not necessarily an expensive shader. Correlate CPU preparation, submissions and GPU progress before changing rendering quality.
Choose a focused change that matches the observed pass: investigate material complexity, visible content, lighting/shadow configuration or the relevant feature’s settings. Preserve the required appearance and repeat the same scene. A lower isolated pass duration is useful evidence, but acceptance depends on the whole frame and the visual or memory tradeoff, not a screenshot of one improved counter.
Common mistakes that waste optimization time
- Optimizing Draw as though it were GPU time. Rendering preparation is CPU work; inspect the thread responsible.
- Adding Game, Draw and GPU values to estimate a frame that contains overlap and synchronization.
- Calling an uncapped scene GPU-bound because a capped FPS counter did not change after an experiment.
- Using average FPS to diagnose a first-use hitch. Capture the specific delayed frame and its trigger.
- Comparing PIE with a packaged build at different resolution, scalability or cache conditions.
- Treating lower quality as a verified fix before checking the intended visual target and actual limiting frame.
- Ignoring profiling overhead or leaving a diagnostic change in the final configuration without review.
A practical bottleneck investigation workflow
- Define the target frame interval, hardware, engine patch, RHI, build and representative scene.
- Record output/internal resolution, upscaler, dynamic resolution, quality, frame cap and VSync.
- Observe Unit timings and separate a sustained limit from sporadic spikes.
- Use a single controlled comparison to form a CPU, GPU or dependency hypothesis.
- Capture the representative interval with the necessary channels and verify the trace contains useful events.
- Follow the limiting work or wait, then select one change with an explicit quality and memory tradeoff.
- Repeat the original workload multiple times with comparable conditions and retain before/after evidence.
- Re-evaluate the limit after the change and confirm behavior in the release configuration on target hardware.
Keep a small investigation record: the observed symptom, the hypothesis, the trace interval supporting it, the single change, and whether the original target was met. Record variance and remaining spikes instead of reporting only the best run. If another thread or pass becomes the limit, update the diagnosis rather than continuing to optimize yesterday’s bottleneck.
Frequently asked questions
Can a UE5 scene be CPU- and GPU-bound at the same time?
Both can have substantial cost and little headroom. The immediate limiting dependency can switch between frames or scenes. Reducing one cost may expose the other, so diagnose a defined interval and repeat the measurement after a change instead of assigning one permanent label.
Does a low GPU usage percentage prove a CPU bottleneck?
No. A frame cap, display synchronization or another dependency can leave the GPU waiting. Inspect the frame timings and trace to establish what prevents the next useful work from completing. Utilization percentages alone do not identify that dependency.
When should a performance specialist get involved?
A scoped audit is useful when timing fields disagree with the apparent symptom, CPU/GPU dependencies obscure the cause, or a release budget must be validated across target devices. Share permitted traces, reproduction steps and build settings. Once the expensive work is understood, hands-on optimization can focus on changes that preserve the project’s intended visuals and behavior.
Still struggling with Unreal Engine performance?
Rendrify provides professional performance audits and hands-on optimization. Start with a focused diagnosis, or explore support for implementing and validating changes.