
Stuttering
How to Fix Stuttering in Unreal Engine 5
Find the frame that missed its budget, identify what delayed it, and test a targeted fix. Separate PSO hitches, streaming work, CPU stalls and GPU spikes without guessing.
How do you fix UE5 stuttering?
Capture a reproducible slow frame in a representative build, identify the work or dependency that delayed it, then change that cause and repeat the same test. Start with frame-time measurements and Unreal Insights, not a universal console-variable preset. Shader pipeline creation, asset loading, gameplay work and expensive GPU passes need different fixes.
Measure the delayed frames, not just average FPS
Stuttering is uneven delivery of frames: a frame takes noticeably longer than its neighbors, or the cadence becomes irregular. A low but steady frame rate is a different symptom. The arithmetic budget for 60 FPS is about 16.67 ms per frame; for 30 FPS it is about 33.33 ms. These are target intervals, not benchmark results or guarantees that a hitch below a particular duration is invisible.
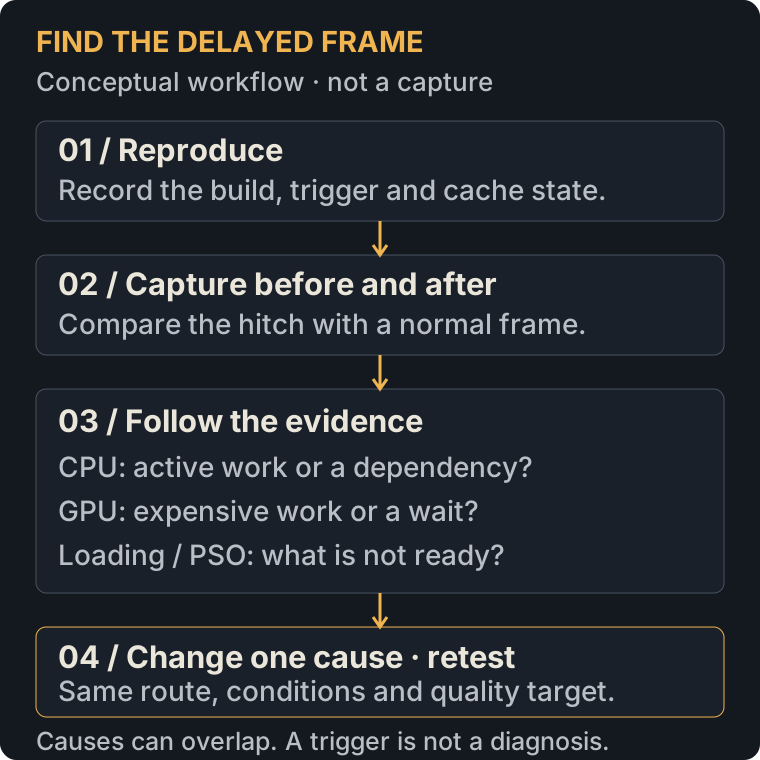
Record the trigger: turning a corner, entering a streamed area, spawning an effect, opening UI or periodically playing without moving. Note whether it happens on first use, after restarting the process, or on every pass. A smoother repeated run is evidence that some state changed; it does not identify which cache, resource or subsystem caused the original delay.
Build a repeatable baseline outside the editor
Use a packaged Development build to retain diagnostic access while running cooked content. Match target hardware, graphics API, resolution, scalability, upscaler, frame cap and VSync. Save the exact route or sequence of inputs. Record the engine patch and build identifier, not just “UE5.”
PIE is useful for finding a trigger, but it is not the final acceptance environment. Editor activity, shader compilation and already-loaded content can change the workload. Conversely, a packaged build can expose first-use or loading behavior that a warm editor session hides. Compare equivalent settings; do not infer that packaged builds are intrinsically faster or slower. Finally validate the actual release configuration using the instrumentation it supports.
Capture and inspect the hitch in Unreal Insights
Use stat unit for an overview and stat unitgraph to watch changes over time. Then capture the reproduction, including a short interval before and after the hitch. The following console sequence uses the file-trace command and its trace channels. Run the first line, reproduce the hitch, then run the second; do not paste both as an immediate pair.
Trace.File StutterReview.utrace cpu,frame,bookmark,loadtime,gpu
Trace.StopOpen the resulting .utrace in Unreal Insights. In Timing Insights, locate the long frame in the Frames panel and inspect the same interval in the Game Thread, rendering and available GPU tracks. Compare with an adjacent ordinary frame. Expand the long event and inspect its callers, callees and surrounding work instead of accepting the top-level name as the explanation.
Distinguish work from waiting. A long wait on the Game Thread may be caused by another thread, loading or GPU synchronization, not expensive gameplay code inside that wait. Follow the dependency before choosing a fix. Missing events are not proof that a subsystem did no work: check trace channels and instrumentation. Keep captures focused, because profiling itself adds overhead.
Separate shader compilation from PSO-related hitches
Shader compilation in the editor and runtime pipeline-state creation are related but different operations. Cooked shaders do not by themselves prove that every graphics pipeline state will be ready before first use. PSO precaching collects pipeline states and compiles them ahead of use, subject to RHI support and coverage.
If a hitch coincides with first rendering a material or effect, investigate PSO evidence rather than diagnosing from the trigger alone. For a controlled diagnostic run with PSO precaching supported and enabled, use the documented validation controls below. First record the previous value; restore it after the investigation so validation logging is not silently left enabled.
r.PSOPrecache.Validation
r.PSOPrecache.Validation 2
stat PSOPrecache“Missed” indicates a required PSO was not precached; “Too late” indicates it was queued but unfinished when needed. These findings lead to different investigations: unsupported coverage or incorrect state collection versus request timing and compilation readiness. Untracked PSOs can appear as misses in Shipping builds, so do not compare counters across configurations without that context.
Review the project’s loading-screen readiness and component behavior before changing PSO policy. Delaying drawing or substituting a material can change the symptom without satisfying visual requirements. Preserve a documented first-run test as well as warmed runs: a graphics-driver cache from previous runs can mask PSO issues. Do not clear a developer’s system-wide caches casually or call a warm-only test a complete fix.
Investigate asset and texture streaming separately
A hitch at a world boundary is not automatically a disk-speed problem. Inspect loading events alongside Game Thread activity to see whether package loading, dependent work or making content ready coincides with the delay. An asynchronous request does not prove every subsequent operation is off the critical path. Look at when the player needs the content and which step is unfinished.
stat streamingFor conventional texture streaming, compare required memory, the streaming budget, wanted mips and pending work. A pool warning alone does not establish the hitch cause. Raising the pool without checking device memory can simply trade one resource problem for another. Unfinished incremental processing of newly loaded levels can require immediate work when a level becomes visible. Use that as a hypothesis to investigate, not a reason to copy an arbitrary streaming budget.
Choose the next investigation from the evidence
| Observation | Next investigation | Avoid assuming |
|---|---|---|
| Game Thread work expands | Expand gameplay, spawning, animation or other observed scopes in Timing Insights. | Every long Game Thread interval is active CPU computation. |
| Render Thread work expands | Inspect CPU-side rendering preparation and dependencies. | “Rendering” necessarily means a GPU bottleneck. |
| GPU work expands | Inspect expensive GPU passes and the workload visible during the spike. | Lowering resolution fixes PSO creation or loading. |
| First-use hitch with PSO validation evidence | Separate Missed from Too late and review readiness/coverage. | A warm replay proves first-use behavior is fixed. |
| Hitch near a loading boundary | Correlate load events, readiness and thread stalls. | The texture pool is responsible for all streaming delays. |
For a GPU spike, inspect what changed in the scene at that moment, rather than disabling Nanite or Lumen globally. For CPU spikes, identify the recurring or burst work that actually expanded. If engine frame times remain stable but visible motion does not, investigate presentation, input, network or display behavior separately; an engine timing capture is not a complete measurement of displayed frame pacing.
What to fix after identifying the cause
Once a capture supports the diagnosis, choose a corrective direction that addresses the delayed work or dependency. The options below are starting points for investigation, not universal or guaranteed fixes. Confirm the change in the original reproduction and check its quality, memory and loading-time tradeoffs.
| Confirmed cause | Possible corrective direction | What to verify afterward |
|---|---|---|
| PSO misses or late compilation | Investigate precache coverage, request timing and loading readiness. Distinguish a missing PSO from one requested too late. | Required pipeline states are ready when needed in documented first-use conditions, not just a warmed replay. |
| Asset-loading stalls | Investigate content readiness, loading dependencies and opportunities to prepare assets earlier. For conventional texture-streaming issues, inspect its specific readiness and budget metrics. | The dependency no longer delays the same route, without unacceptable memory use or startup/loading time. |
| Game Thread spikes | Optimize the expensive work identified in the trace. If the long interval is a wait, follow its dependency rather than optimizing unrelated gameplay code. | The identified work or dependency and the delayed frame improve without changing required gameplay behavior. |
| GPU spikes | Optimize the measured expensive passes while preserving the project’s visual requirements. | The original scene meets its whole-frame target, with acceptable appearance and resource use. |
A step-by-step diagnostic checklist
- Record the engine patch, target platform/RHI, hardware, build configuration and reproducible trigger.
- Match resolution, quality, upscaling, VSync and frame-cap settings; distinguish sustained cost from a spike.
- Capture the event and surrounding context in the representative packaged build.
- Find the delayed frame, compare a normal neighbor and follow work or waits across relevant tracks.
- Test the supported PSO, loading, gameplay or GPU hypothesis with the appropriate evidence.
- Make one reversible change and record its visual, memory, loading-time and gameplay tradeoffs.
- Repeat the same route multiple times under the same documented first-use and warmed conditions.
- Validate the release configuration on target hardware; retain the before/after captures and unresolved cases.
Frequently asked questions
Will enabling PSO precaching remove all stuttering?
No. It addresses a class of pipeline-compilation problems, not all CPU, GPU or loading spikes. Support, coverage, readiness and runtime behavior still need validation. A documented setting being enabled is not evidence that a specific hitch has been removed.
Should I profile in Shipping or Development?
Development is a practical starting point for console-based diagnosis. Standard Shipping removes console commands, stats and profiling tools not intended for end users. Recheck the eventual release build rather than treating a Development result as its exact performance.
When does specialist help make sense?
Consider a performance audit when a repeatable hitch has no clear dependency chain, several subsystems interact, or the release decision depends on target-device evidence. Provide the reproduction, hardware/build settings and permitted captures. A useful outcome is a prioritized diagnosis and validation plan, not a promise that one setting will solve every project.
Still struggling with Unreal Engine performance?
Rendrify provides professional performance audits and hands-on optimization. Start with a focused diagnosis, or explore support for implementing and validating changes.